
In June 2015, the India eBirding challenge was to upload at least 20 complete lists (of at least 15 min each) from a single location. Why is this an interesting thing to do and what can one learn from this? Here we explore these questions.
As birders we often like to explore as many different places as possible and see as many species as we can. But we might also have a favourite location or ‘patch’ that we frequent. This might be the locality where we live, or a nearby park or lake or patch of forest.
Can we, though our repeated visits, build up detailed information of the birds in these patches? The answer, of course, is yes! All we need to do is survey the patch repeatedly and write down what we find. These ‘surveys’ can be more or less sophisticated — the simplest is to keep a list of all the birds you see during each survey. And this is exactly what the June challenge was about.
How can one use the information collected in this way? Here are some possibilities:
1. Assess the ‘completeness’ of the survey. This can be done by making a graph of the total species seen against the number of lists. As you can see from the examples below, in the beginning the line rises rapidly because new species are seen in each subsequent list. But as more lists are added, fewer and fewer new species are seen. If the line is completely flat at the end of the survey it’s a sign that all or almost all species present have been seen. If the line continues to rise then it’s a hint that the total species list is incomplete.

Examples of accumulating species counts with repeated surveys at a single location. This can be used to understand the graphs at the bottom of this post.
2. Estimate the total number of species present. If the line described above is flat at the end of the survey, you can draw a line to the left and see how many species are likely to inhabit the locality. Use this with caution if the line is still rising!
3. Assess the relative common-ness and rarity of different species. This can be done very simply by calculating the frequency of sighting of each species. Very common species will be present in close to 100% of lists; rare species will be seen only a few times out of the total number of lists. These percentages can then be compared over seasons or years. Do note, though, that there are limitations to this simple method. For example two species may have the same true common-ness, but if one is vocal and the other silent, they may yield very different percentage calculations!
…
As an illustration of the information that can be generated from repeated surveys/lists at a single location within a single month, we have taken the June survey data (ie eBird lists) from those who met the challenge for that month, and have created the same graphs as above for all locations covered in this way. (For standardization, we took only locations that had at least 20 lists of 15-20 min duration each.) The results are in the graph at the bottom of this post. There is a lot to explore in these graphs, but to summarize:
1. A diversity of locations are represented, some relatively poor in species (total species around 20) and others very rich in species (total around 50).
2. In some locations, the species number rose rapidly as lists were made, thereafter flattening out. However in other locations, the species numbers continue to rise even after 20 lists were completed. This implies that in some places, even 5-6 hours of birding is insufficient to document all the bird species present. This is a very sobering thought!
3. Across many of these locations (which are from Kerala, Tamil Nadu, Karnataka, Delhi and Assam), the usual House Crow and Common Myna appear frequently in the list of most-observed species. But other species appear too, including Common Tailorbird, Asian Koel, and Oriental Magpie-Robin.
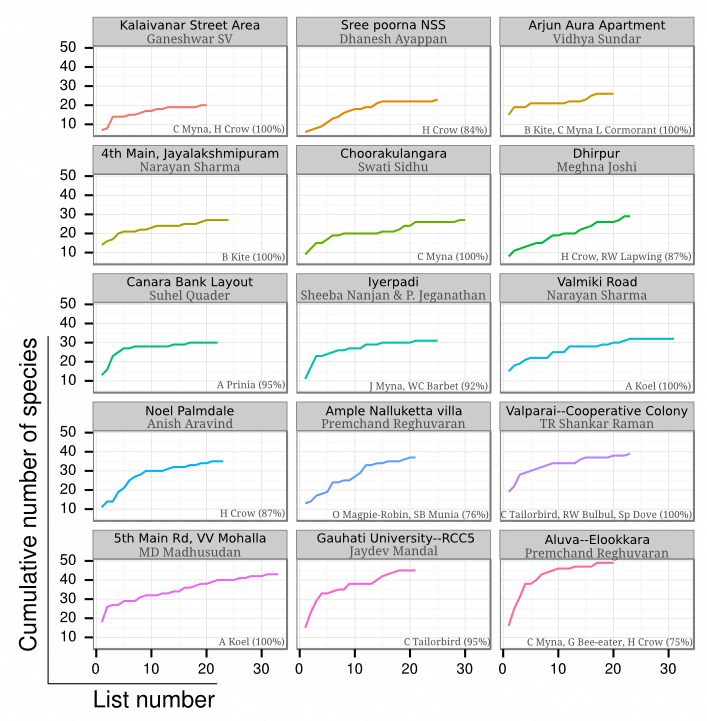
Information on change in species totals with repeated lists from fifteen locations with 20 lists or more (each 15-20 min) in June 2015. The locations differ in their total species, how rapidly new species are discovered, and in the identity of the most common species.
So much information from the simple act of repeated birding! We hope you are inspired to make repeated lists of the birds you see at your favourite location!
Header Image: Rusty-tailed Flycatcher Ficedula ruficauda by Aseem Kothiala/Macaulay Library


Thanks Birdcount India for publishing this analysis.
We need to spread this to other birders also…
Thanks
Premchand
Thank you! Please feel free to circulate the link. Can you suggest other ways to spread this among birders?
Hi BirdCount,
We need to give a slide show during a meeting and explain.
Also we can start monthly or Bi-monthly meeting in all NGO’s like CNHS, WWF and MNHS etc with birders and reviewers. Also we don’t say a list – say Documentation of your birding.
We need to focus birding and ebird is an online documentation for your birding. When ‘List’ comes, some birders think that they are working for eBird. We can replace birders paper document when we use ebird, some point like this should be highlighted
Thanks
Great ideas, thanks! Yes, eBird is just a tool that can help us with what we want — whether it is to maintain a record of our own personal birding; or to run projects like the Kerala Bird Atlas. So it’s a tool that is available if we want it. We (Bird Count India) have been conducting workshops in different parts of India, and would be happy to come and share our thoughts with any other interested groups.