The Pied Cuckoo is well known to birdwatchers and in folklore as the bird that heralds the beginning of the monsoon. Legend has it that the ‘chaatak’ arrives just in advance of the rains. When the first Pied Cuckoo of the season is spotted, the rains can’t be far behind.
The story is a little more complicated. This species is resident in southern India and is seen there all year round. However, in central and northern India, it is absent in the dry months of January to May. In late summer and early monsoon, they suddenly appear. All evidence points to their coming from Africa, crossing the Arabian Sea by riding the monsoon winds.
With increasing reporting of bird sightings on public platforms, it is now possible to evaluate how true the folk story is: Does the Pied Cuckoo’s arrival in central and northern India coincide with the arrival of the monsoon? In MigrantWatch, a previous project to document the migration of Indian birds, a few attempts had been made to answer this question, using animated maps, and analyses of arrival dates.
Now, with the use of eBird taking off in India, vastly more information is available to tackle this question. Ecologist and eBirder, MD Madhusudan (eBird profile | Twitter: @mdmadhusudan), decided to put together data from different sources to create a visualization of Pied Cuckoo sightings in India together with the advance of the monsoon. More details are below, but in brief, he took over 8,000 records of the species over the years 2011 to 2016, together with rainfall information over the years 1981 to 2017, and the result is the stunning animation shown here.
The animation shows only a part of the year (1 April to 31 July). You can see that until mid May, the vast majority of Pied Cuckoo sightings are in the southern part of the peninsula. Then, as the monsoon arrives and spreads, sightings of the species also spread, until the entire subcontinent is covered by both rain as well as Pied Cuckoos!
Note that the red points on the map are not all Pied Cuckoo records, but are restricted to the 95% of records that are clustered together. For this reason, a few unusually early reports do not appear, and also reports from the edges of the species range (eg Uttarakhand) are not shown. The animation shows the bulk of the sightings, not every single one.
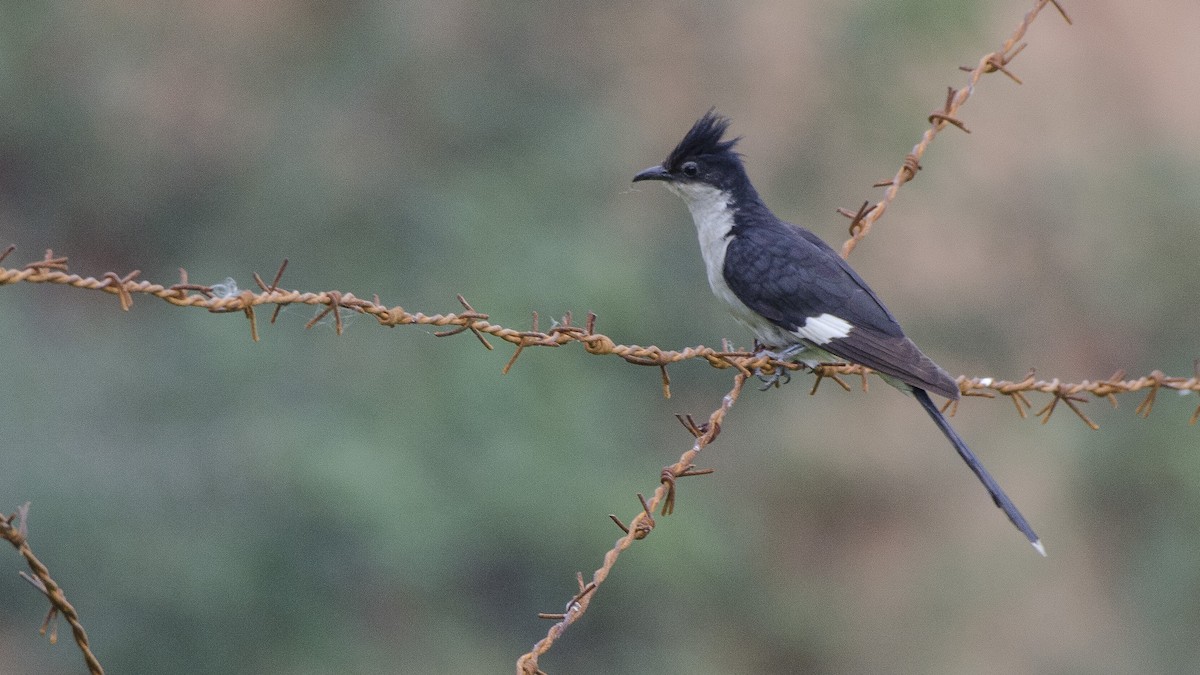
Pied Cuckoo at a crossroads, by Parmil Kumar/Macaulay Library at the Cornell Lab. From this checklist.
Details of Data and Methods
Terrain visualisation
Dataset & Methods: I used the Shuttle Radar Topography Mission (SRTM) digital elevation data and created a hill shaded terrain which was used as basemap.
Monsoon visualisation
Dataset: I used the publicly available Climate Hazards Group InfraRed Precipitation with Station (CHIRPS) Data-v2.0 Final dataset, which spans a 36 year time period (1981-2017) and combines 0.05° satellite imagery with in-situ station data to create a gridded rainfall time-series. The data are presented for 6 pentads each month. Each of first 5 pentads in a month have 5 days. The last pentad contains all the days from the 26th to the end of the month.
Methods: First, for each pentad (ie 5-day period), I computed the median value across the 36 years between 1981 and 2016. I was thus able to reduce the entire dataset into a collection of 72 rasters, each representing a pentad for which values were aggregated over a 36-year period. I then converted the collection of 72 continuous rainfall rasters thus obtained to 13 discrete contour intervals between 0 & 100 mm rainfall within a pentad. Contours for areas receiving less than 10 mm of rain over a pentad (i.e., approximately 2 mm rain per day or less) were dropped from the visualisation. Data between 1-April and 31-July were used in the final visualisation.
Pied Cuckoo Distribution Visualisation
Dataset: I used publicly available data on the Pied Cuckoo from the global citizen science effort, eBird, gathered through their India partner, BirdCount India. These data are available as time/space coordinates for when/where Pied Cuckoos were reported. I used raw data between 2011 and 2016 containing 8,052 Pied Cuckoo locations in the analyses.
Methods: I assigned each report of Pied Cuckoo in the dataset to a pentad that was identical to that used in the CHIRPS dataset used for the monsoon visualisation above. Then, for each pentad, I excluded within-year-within-pentad outliers by dropping locations that lay outside a 95% minimum convex polygon. I then aggregated the resulting data from each year between 2011 and 2016 for each pentad. From this cumulative dataset, I dropped across-year-within-pentad outliers by dropping locations that lay outside the cumulative 95% minimum convex polygon. Locations between 1-April and 31-July were used in the final visualisation.
Software
The bulk of the data processing and visualisation was done in Google Earth Engine, with small bits of video annotation in R.
Header Image: Pied Cuckoo (Jacobin Cuckoo) Clamator jacobinus by Novel Kumar/Macaulay Library