Update, Sept 2019: a paper on some broad findings of the Atlas has been published in Indian Birds journal. Download pdf here. The maps and other results shown in the paper may differ slightly from what is depicted on this web page. In any such cases, please take the paper as the definitive source.
Under the leadership of the Mysore Nature group, the Mysore City Bird Atlas project was established to systematically document the distribution and abundance of birds across the city. The basic outline is that the city is divided into 33 grid cells of 1.25×1.25 minutes (approximately 2.2×2.2 km). Here is a google map of Mysore city, with the 33 grid cells overlaid. You can zoom in to see details of which areas each grid covers.
Each of the 33 grid cells is further divided into four subcells of equal size (roughly 1.1×1.1km). During each sampling period, each of the 33 x 4=132 subcells is visited once, for 30 min, between 0630 and 1100 hrs. During this visit, all species seen are noted, and counts are also made.
So far, six iterations of the Atlas have been carried out: in February 2014 (27 Jan to 28 Feb), June 2014 (1 June to 25 June), February 2015, June 2015, February 2016 and June 2016. All lists generated were uploaded to eBird, and then downloaded to make the summaries described here.
You can explore some of the results of the Mysore City Bird Atlas so far using the interactive maps below.
Map 1. Species comparisons between months and years
In each month, each grid cell of 2.2×2.2 km was visited four times. The colours in the maps here depict how frequently, of the four visits, a species was seen: 0%, 25%, 50%, 75% or 100% of these four visits. In other words, the darker the colour in a grid cell, the more frequently the species was seen.
You can find a species by choosing from the drop-down menu. For example, if you look at the maps for House Crow, you see that this species is across the city in both months. By contrast, Black Drongo, a local migrant, is widespread in Feb but almost completely gone in June; and Grey Wagtail, a long-distance migrant, is absent in June. Do also look at Green Bee-eater for a curious pattern.
Note that in February 2015, coverage was not 100% complete. Five grid cells were not covered at all — these are indicated in the maps as transparent cells. A few other grid cells had 2 or 3 of the four subcells covered. Still, the vast majority of grid cells were covered as per the protocol; and coverage was complete in the five other seasons (Feb & June 2014, June 2015, and Feb & June 2016).
Map 2. Number of species, and grid-wise list
This map shows the variation in number of species detected in the 2.2×2.2km grids. The default view shows the number of species from Feb 2014, as well as a list of species seen in that season during the atlas surveys. From the drop-down menu, you can select other combinations of year and month; and also both months of all years to examine the overall number of species. The map will be updated, and the list of species from that month/year combination will be shown on the right. If you hover your mouse/pointer over a grid cell, you will see more information on the number of species observed. To examine the species list from any particular grid, just click on that grid cell. It is interesting to think of possible reasons why total species in each grid cell might vary so much from place to place! For example grid cell 2, 30 and 32 have many, but cells 7, 13 and 14 have much fewer — perhaps this is related to the underlying habitat?
These visualizations have been generated using the Tableau platform from data collected during the Mysore City Bird Atlas and uploaded to eBird. The visualizations were created through the tireless efforts of Sandeep Kumar Jayasankar, and modified in 2015 and 2016 by Abinand Reddy. If you have any suggestions for improving the maps, or creating additional ways to explore the Atlas data, please email us or leave a comment here.
Additional information on the atlas surveys
How comprehensive are the species lists?
In any survey, the question arises about how comprehensive the survey has been. In other words, has the effort expended in the survey been sufficient to find the majority of species present? This can be addressed using ‘species accumulation curves’. At the beginning of the survey, new species are rapidly found. But the rate at which new species are found should decrease, until theoretically, when all species present have been found, no new species will appear. The species accumulation curves for the six seasons of the Mysore Atlas are shown below.
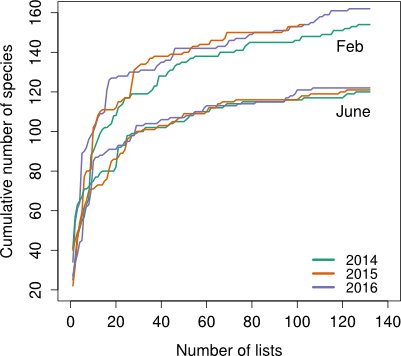
Species accumulation curves for the six seasons of the Mysore City Bird Atlas. In all seasons, it appears that the majority of species have been detected.
As expected, the cumulative number of species increases rapidly at the beginning of the surveys in all six seasons, but by the time all subcells have been covered, the lines are almost flat, indicating that very few additional species are being discovered; which, in turn, implies that almost all species present have been found. (Note that since these are diurnal surveys, nocturnal birds like owls and nightjars are almost certainly under-represented.)
Number of species recorded:
| Feb | June | Total | |
| 2014 | 154 | 120 | 168 |
| 2015 | 154 | 121 | 171 |
| 2016 | 162 | 122 | 172 |
| Total | 187 | 137 | 192 |
As expected, the number of species recorded in the winter (Feb) is more than that in the summer (June), and this pattern is quite consistent across the years. A total of 188 species were recorded within the Mysore City region (as defined by the borders of the atlas).
Frequency of occurrence of different species
The frequency of occurrence of each species was calculated as the percent of the 132 subcells, which makes 132 lists (except for Feb 2015, where there were 103 lists) that the species was observed in. This gives an idea of how often a species is encountered. In other words, the higher the frequency of occurrence, the more ‘common’ a species is.
The table below shows the 20 most-frequently observed species (ie, most ‘common’) in February and June. The percentages are the frequency of sighting of of each species, averaged across the three years. Here is an excel file containing a complete listing of all species observed in each month and each year, together with their frequency of occurrence and their average counts.
| February all years |
June all years |
| 1. Common Myna, 84% of lists | 1. Common Myna, 88% of lists |
| 2. Black Kite, 82% | 2. Black Kite, 88% |
| 3. Rose-ringed Parakeet, 75% | 3. Asian Koel, 84% |
| 4. Blue Rock Pigeon, 69% | 4. Ashy Prinia, 82% |
| 5. Purple-rumped Sunbird, 62% | 5. Rose-ringed Parakeet, 78% |
| 6. Brahminy Kite, 59% | 6. Blue Rock Pigeon, 74% |
| 7. Large-billed Crow, 58% | 7. Large-billed Crow, 69% |
| 8. Asian Koel, 58% | 8. Purple-rumped Sunbird, 67% |
| 9. Ashy Prinia, 59% | 9. Pale-billed Flowerpecker, 62% |
| 10. Spotted Dove, 53% | 10. Red-whiskered Bulbul, 60% |
| 11. Greater Coucal, 54% | 11. Spotted Dove, 59% |
| 12. Red-vented Bulbul, 52% | 12. Jungle Myna, 58% |
| 13. House Crow 57% | 13. Greater Coucal, 58% |
| 14. Red-whiskered Bulbul, 55% | 14. House Crow, 57% |
| 15. Jungle Myna, 51% | 15. Brahminy Kite, 56% |
| 16. Black Drongo, 49% | 16. Common Tailorbird, 54% |
| 17. Cattle Egret, 51% | 17. Red-vented Bulbul, 53% |
| 18. Pale-billed Flowerpecker, 50% | 18. Cattle Egret, 47% |
| 19. Pied Bushchat, 48% | 19. Black-headed Ibis, 46% |
| 20. Purple Sunbird, 43% | 20. Pied Bushchat, 46% |
In most cases, species that are commonest in one season are also commonest in the other. A notable exception is Black Drongo, which is ranked #16 in February, but disappears almost entirely in June.
Now, we might be interested in examining (A) for each season, how consistent are the frequencies across the years; and (B) for each year, how do the frequencies change from Feb to June. A direct and visual way of assessing this is presented for selected species in the charts below.
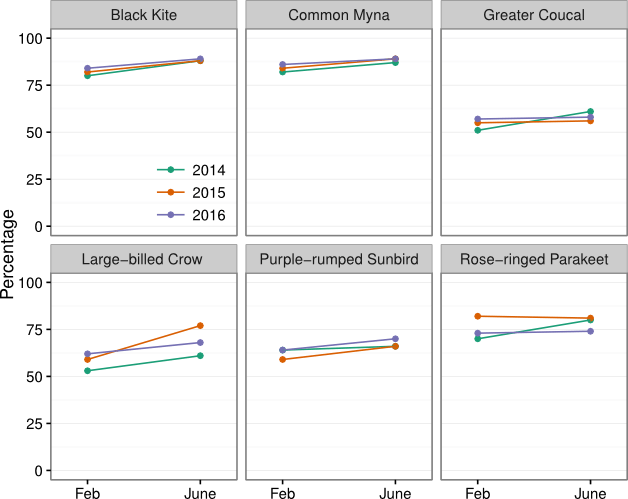
Species that remained roughly stable between Feb and June. Note some year-to-year variation in Large-billed Crow reporting. But in general, the patterns for these species are very similar across the three years.
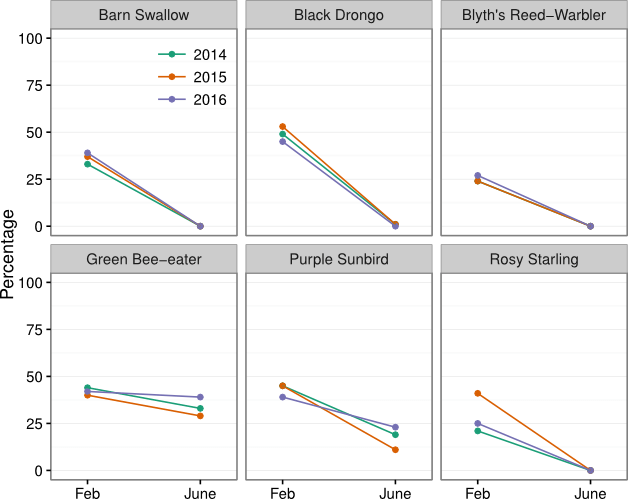
Species more common in the winter (Feb) than the summer (June). Note that for almost all these species (barring perhaps Rosy Starling), the pattern is very similar across the three years. Winter migrants are expected to disappear in the summer, but Green Bee-eater, Black Drongo and Purple Sunbird are resident species, perhaps showing local movements.
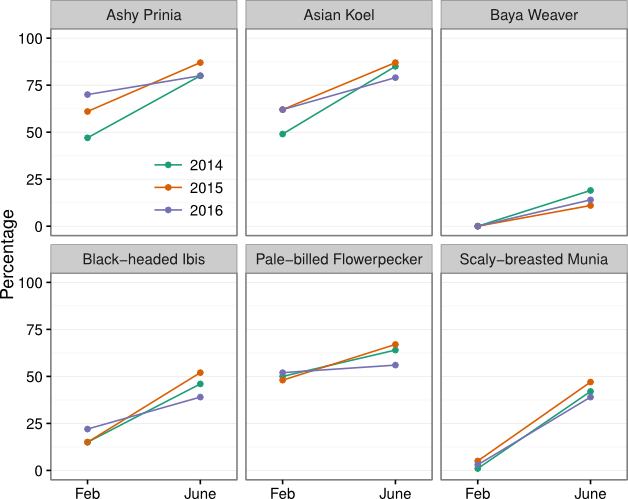
Species more common in summer (June) than in winter (Feb). Again, for each species, the patterns are largely similar across the three years. What may be happening with these species? Are they really showing movement into Mysore city during the summer? Or are they more vocal and/or visible, and therefore more easy to detect during the summer? Do check the corresponding maps for these species using the interactive applet above.
The Mysore City Bird Atlas has generated a wealth of excellent information about the birds of the region — all credit to the Atlas team!
Credits/Acknowledgements
The Mysore City Bird Atlas was coordinated by A. Shivaprakash and BR Sheshgiri.
Participants in the atlas were (please let us know if any names have been inadvertently left out):
Feb 2014: Ashrita Anoop, Anagha Bagade, Sahana M, T Girija, DH Tanuja, Shanmugam R, Dinesh KS, Harsha NR, Naveen Jois, Shiv Kumar, Arun Simha, Kiran Bagade, Thorkild Michaelsen, BR Sheshgiri, A Shivaprakash.
June 2014: Abhijit APC, Anagha Bagade, S Ananya, Archishmati, Arun Simha, Ashrita Anoop, Charumati CM, Dinesh KS, T Girija, Harsha NR, Kiran Bagade, P Maheshwari, Naveen Jois, Sahana M, KB Sadananda, Sandeep Srivatsa, BR Sheshgiri, A Shivaprakash, Shiv Kumar, Sukrit, Shweta Bharati.
Feb 2015: Abhijit APC, Abhishek, Aman, Anagha Bagade, Arun Simha, Chandrashekar, Dinesh KS, T Girija, Harsha NR, Kiran Bagade, Kaleemulla Sharieff, Kashyap, Krishnamurthy, Sandeep, Shiv Kumar, A Shivaprakash, Swetha B, BR Sheshgiri, Sahana M, Tanuja DH.
June 2015: Navya R, Vishak, Raghunath R, Tanuja DH, Sahana M, Swetha B, Shamkumari C, Naveen J, Vinay N, Dinesh KS, Harsha NR, Narayan Sharma, Janhavi Rajan, Shivakumar, Smitha SP, Madhusudan MD, Pavithra Sankaran, Manish Chandi, Mohankumar, Kiran BS, Michaelsen T, BR Sheshgiri, A Shivaprakash, T Girija.
Feb 2016: Aman Khan, Anagha S, Chndrashkear SG, Girija T, Harsha NR, Naveen Jois, Kiran B, Pavan Ramachandra, Raghunath R, Sahana M, Sheshgiri BR, Shiv kumar, Shiva prakash A, Shylajesh R, Sneha Guptha, Suresh VP, Syed Ateeq, Syed Mudaseer, Tanuja DH, Swetha Bharathi, Vinay Nadig, Yogendra HS.
June 2016: Smitha Rao, Gouri, Raviprakash, Amathya, Shreeraksh Bhat, Shylajesh, Chandrashekar GS, HS Yogendra, Amanull Khan, Navya Ramesh, Vinay Nadig, Raghunath, Swetha Bharathi, KS Dinesh, Shivakumar, R Pawan, APC Abhijith, Kiran Bagade, Arun Simha, NR Harsha, M Sahana, B Anagha, VP Suresh, DH Tanuja, BR Sheshgiri, T Girija, and A Shivaprakash.
Design and execution of Tableau visualizations: Sandeep Kumar Jayasankar and Abinand Reddy. R. Raghunath helped with GIS-related matters.
Further information is available on the Mysore Nature webpages, where you can also find contact information.
Header Image: Egyptian Vulture Neophron percnopterus by Vijaya Lakshmi/ Macaulay Library

