Examples
Here are some example analyses carried out in the past by the Bird Count India team to explore some of the data in eBird. In each case, we provide step-by-step procedures so that you can get a sense of the kind of data processing that was done to arrive at the result.
First things first!
The very first thing to consider, even before downloading the data, is whether you want to use the entire dataset for India. If you do, be warned that there are 4 million rows in the dataset, and you will not be able to open this file in Excel. If your software has a limit on the number of rows it can read (Excel’s limit is around 1 million), then it might be best to download a subset of the data, rather than all India. For example, you can download the data for only a single State or for a single species, or for a restricted date range. (Note that the download page gives the option to ‘include unvetted data’. For most purposes, it’s best to exclude such data.)
If you do want the entire India data, you will need to use a suitable software program to subset what you want. For example, one commonly used software platform for analysis and graphics is R. In R, you would open and subset the data using commands similar to those below.
dat <- read.delim("ebd_IN_prv_relAug-2016.txt", na.strings = c("NA", "", "null"), quote="")
## check the column names
names(dat)
## subset only data from Kerala
kl <- subset(dat, STATE_PROVINCE == "Kerala")
## check if number of rows are OK
nrow(kl)
## gives 889,898, just about OK for Excel!
If you have trouble opening the downloaded data, or are stuck at any stage, please let us know in the comments below, or on the Facebook event page.
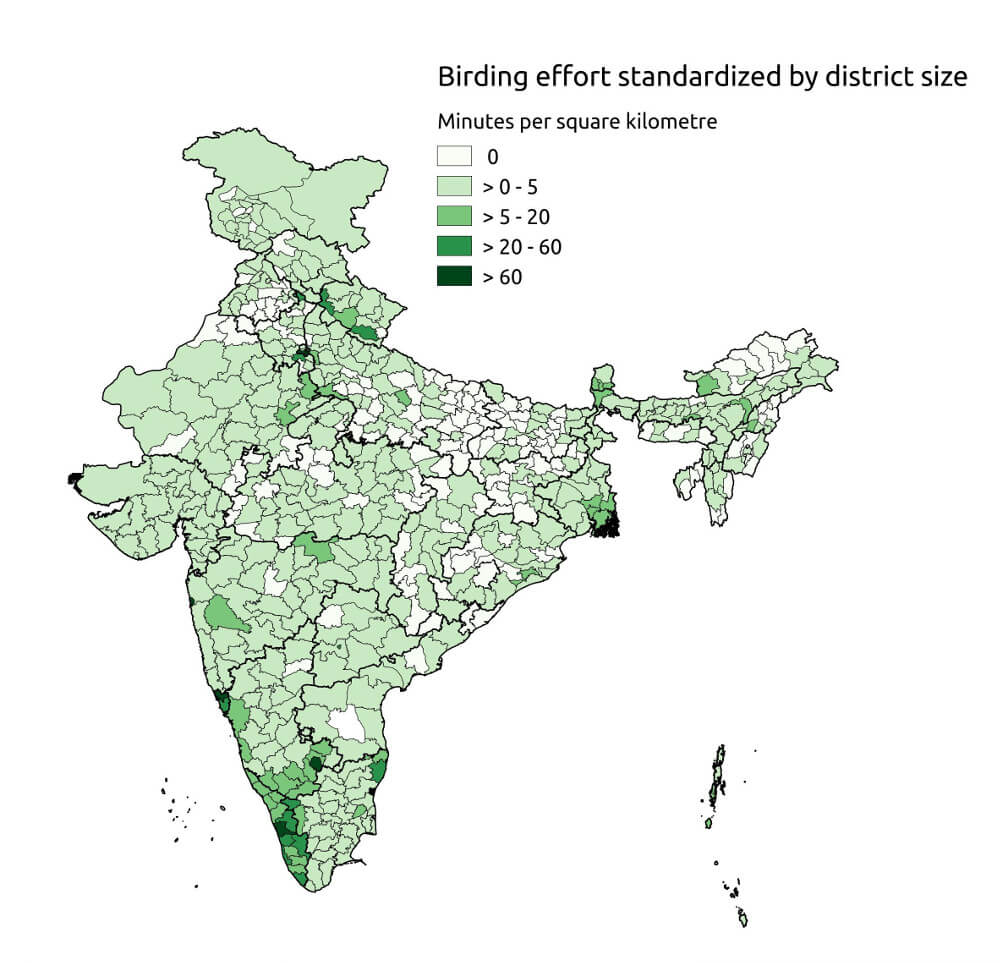
Example question 1: What is the country-wide distribution of birding effort represented in eBird?
The motivation behind this question might be to assess which areas (let’s say Districts) have the most active eBirders, and also to identify gaps in bird information such that efforts can be made to fill them.
To answer this question, it is necessary to count up the number of lists per District. We might first want to create a new spreadsheet (or ‘dataframe’, in R) in which each list is represented by one row (in contrast to the raw data, in which each record is represented by one row, and therefore each list may have several rows). In Excel, this can be done using pivot tables.
Once this is done, we can tabulate the number of rows per District and then arrange in descending order, perhaps. If we want to display the results on a map, then we need to download map data for India showing administrative boundaries, match the District names from eBird to the map data; and then use software like QGIS to display a map of effort.
Examining this map could tell us where eBirders are most active, and conversely, where the major gaps in information are. See an example of this kind of analysis in an earlier post on birding gaps.
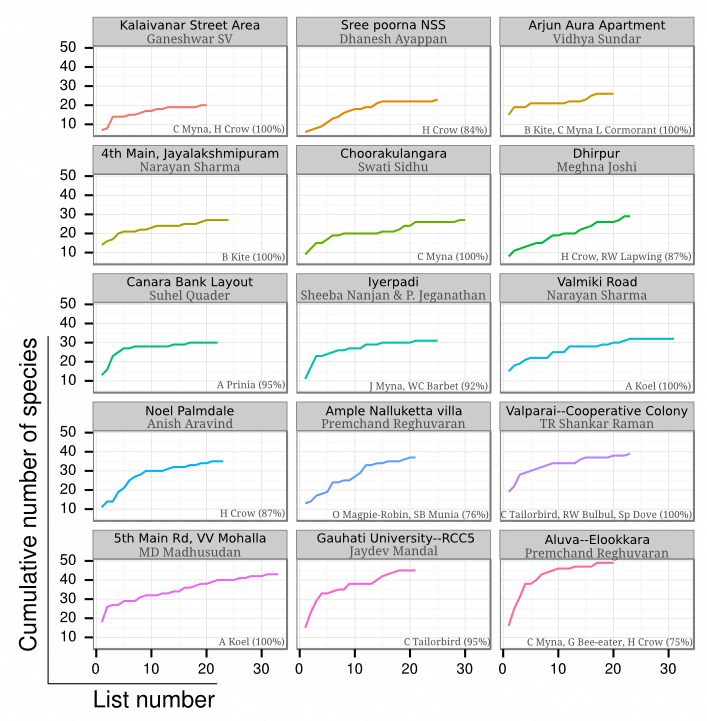
Example question 2: How much birding is required in a single spot in order to find all or at least most species?
In other words, how much birding effort is required to adequately document the birds of a place? For this, we might take a single location that has substantial birding effort, and look at how species numbers accumulate with effort. To put it another way, as the total amount of time spent birding in that location increases, what is the pattern of increase in the total number of species seen? We would expect there to be a rapid increase at first, and then gradually to stop increasing. The point (amount of time, number of lists) where new species stop being found might be considered adequate effort for that location.
To examine this, after choosing a particular location, we would want to order the birding lists in sequence (from earliest to latest, the checklist ID gives this), calculate the accumulated species seen and plot that versus the accumulated number of lists or the accumulated time spent birding.
To see an example of this done in the past, please look at an earlier analysis of repeated lists at a location.
Example question 3. How well are Important Bird and Biodiversity Areas (IBAs) in India covered in eBird?
IBAs are areas of particularly rich and/or threatened bird diversity. Clearly it is important to document and monitor the birdlife within them. Very few Indian IBAs have regular monitoring programmes; can birdwatchers uploading their birdlists to eBird contribute useful information?
For this, we first need a digital map of IBAs from India. Once we have the boundaries of different IBAs, we can check which eBird lists have been contributed from within those boundaries by looking up the latitudes and longitudes of the lists. From those eBird lists from within IBA boundaries, we can then calculate the amount of eBirding (in terms of lists and/or duration) from each IBA, and sort them to see which are heavily and which are poorly eBirded.
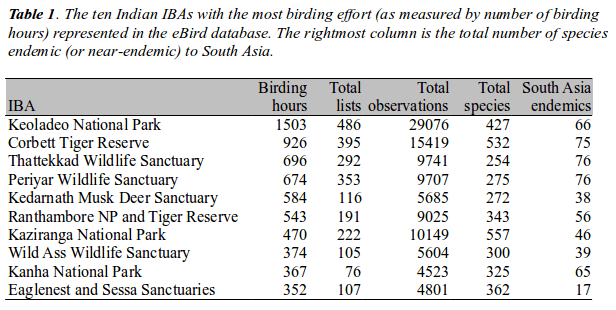 For a single IBA (or a set of them), we could also calculate the reporting frequency of each species. The reporting frequency for a particular species is the proportion of ‘complete’ lists that contain that species. The reporting frequency can be compared (with caution!) across IBAs and across seasons/years.
A brief analysis looked at these sorts of questions for IBAs before.
From across the World
eBird data have been used in a large number of research and conservation applications across the world, and cited in various scientific publications. Here we highlight two examples of interesting work that uses eBird data; both from North America.
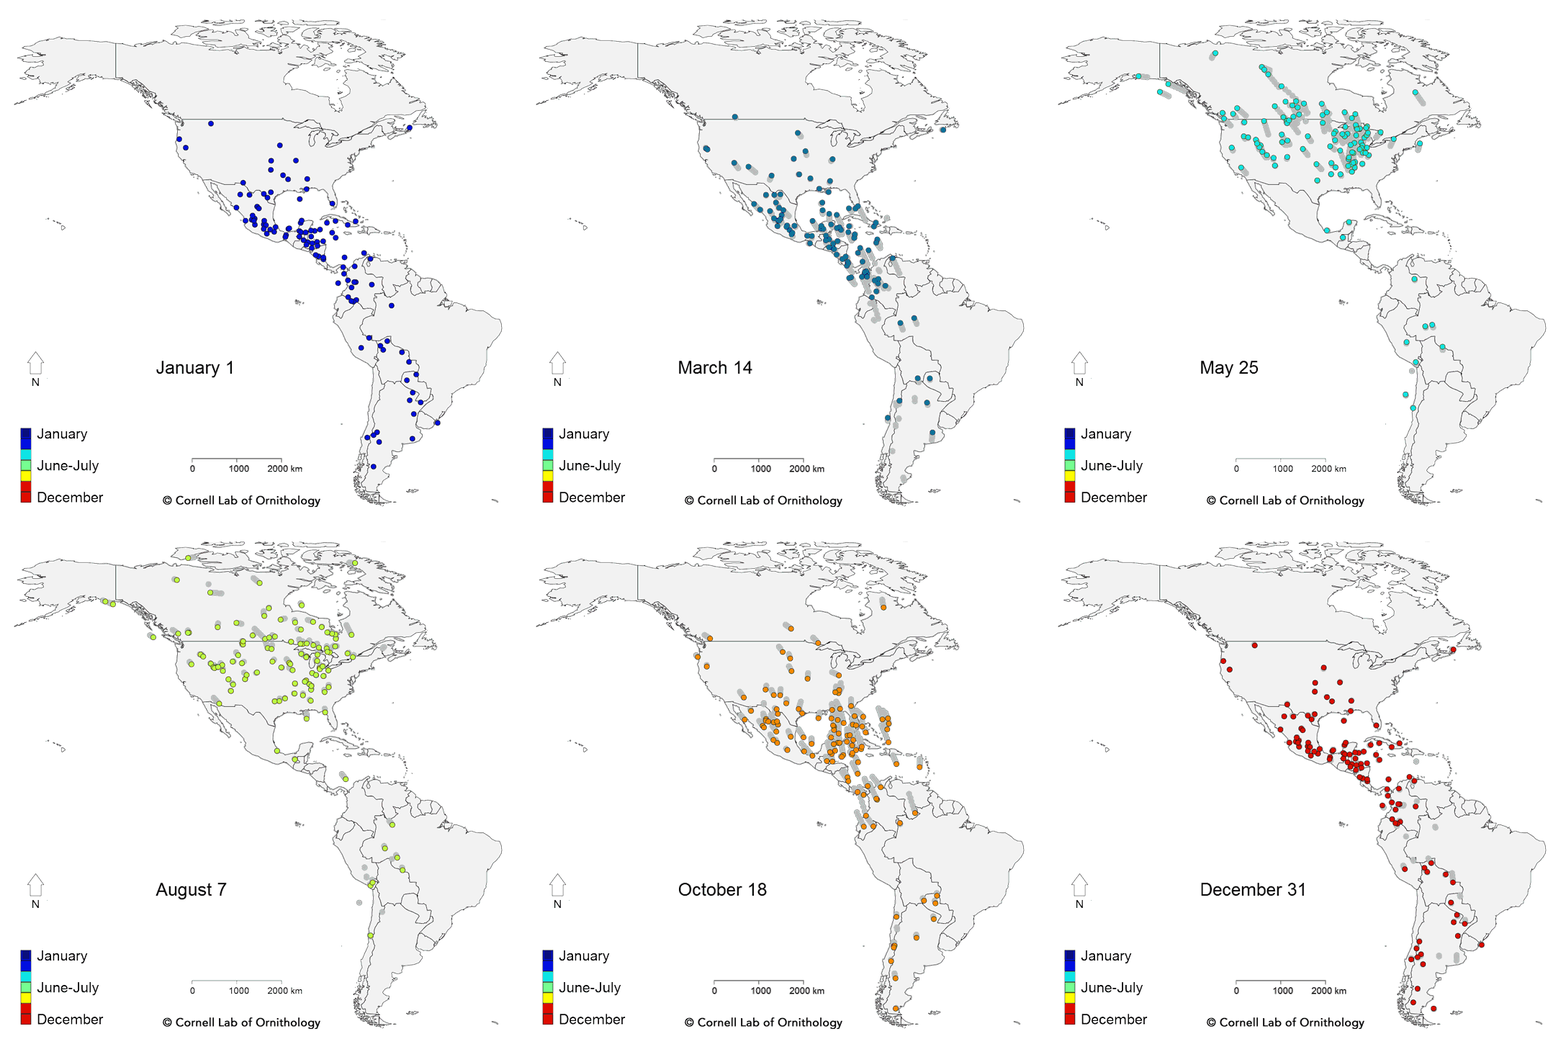
In the first piece of work, an animated migration map of a large number of species was created by carrying out species distribution modelling on data submitted to eBird by participants. The map shows the movement of transcontinental migrants based on the aggregation of large amounts of information on observation of birds in space and time.
The second piece of work we highlight here is an assessment of how observation skills of individual birders increases over time. It looks at how individual birders at a particular place discover new species and whether this can be used as a measure of differences and changes in observation and identification skills. The conclusion is unsurprising: the more you watch birds, the better a birder (in terms of observation and identification skills) you can become!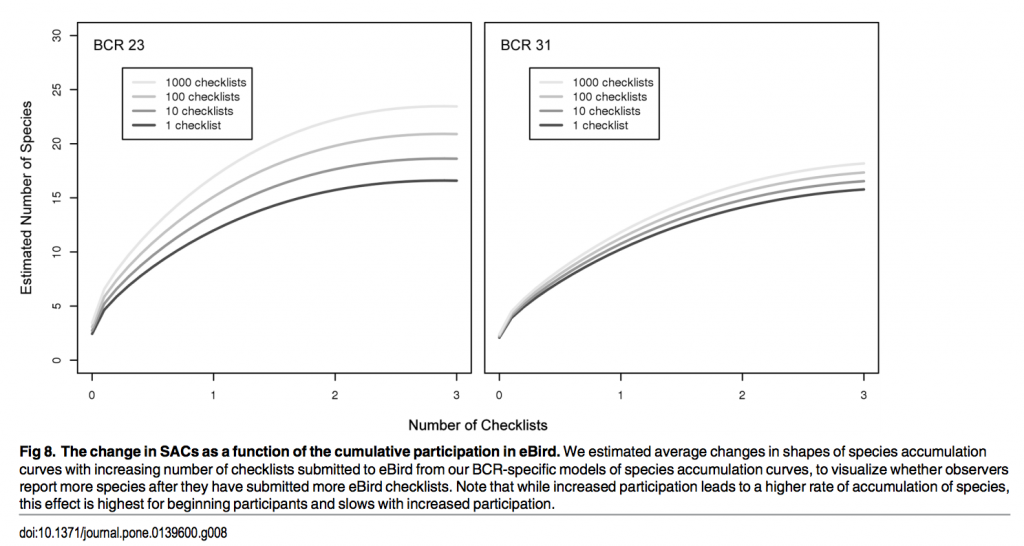


Views for Suggestion no 5, Mike ebird have started profile page for each members but some way to contact is missing. Might b email I’d or any social media links or such. Will help to contact the checklist submitted for new locations who travel for birding.
Or for getting more data for any sort of research, like from last try for learning year around migration of Indian skimmer, had seen they move from Gujarat to chambal during Oct end through Rajasthan. But not much details from Rajasthan. Might have contacted few local birders who had recorded previously.
Yes,communication / discussion with eBirders w.r.t.checklist, self checklist,any ID issues are not discuss.Some method is required.Regarding monthly challenge…declared by eBird,great participation by Birders,eBird of month declared …But what’s the outcome of eBird Monthly challenge not discuss…some method or links is essential.
The Common Name should be assign for each of IBA by eBird / BIRD COUNT OF INDIA or any other related agency wih definite identified boundries.When any eBird submit checklist from said IBA a previously decided Name of IBA should be display for eBirder.
For example— Hatnur Dam is recent & only one IBA in Jalgaon District-Maharashtra.But eBirders submit their checklist like Hatnur dam,Hatnur dam & surrounding area,Tandalwadi,Damleft,Dam right,cannal side,IBA etc.
Due to which IBA or Hotspot not identified some of the lists of same area.If you assign a Fix or particular ID for each IBA with decided boundaries /area future data analysis is correct for The said IBA.
I myself use different names previously for different locations in same IBA …HATNUR.And always hesitate how I can give same name as IBA at different locations in same area / locations… sometimes more than 5KM apart from each other.When we analyse the IBA as one patch/area different locations( in same IBA) used by eBirder should identify as Single ID decided by eBird ¬ by eBirder.
Thank you Sir. One of the problems is that we do not have boundaries of all IBAs in digital form, otherwise what you suggest would be possible. At the moment, hotspot naming is not under the user’s control — but any personal location (ie, not suggested or added to a hotspot) is under the user’s control. For personal locations, the name given is less important than giving the precise geographical location (lat-long).
In the future (we hope soon), eBird will move away from designating hotspots as point locations, and instead delineate hotspot boundaries — when this happens, all lists (including lists from personal locations) with latlong within the hotspot boundary will be aggregated into that hotspot for output. It will also be possible to have ‘daughter’ hotposts within a single ‘parent’ hotspot. For example, Hatnur Dam hotspot will be able to include Hatnur Backwaters as a daughter.
This IBA HOTSPOT issue is important for analysis of bird count,migration,Nesting & Nesting Behaviour, Inter – dependency of birds,etc.Importance is increased when Habitat is Mixed like water body,Farm land,Near by river bed,wet land,Jungle area,Grass Land & much more.
When I submitted Question in Question pool error message seen & question not submitted
cURL error 28: Operation timed out after 1000 milliseconds with 0 bytes received
Is there any limit of nos of words?
Sir, is this what you submitted?
—
The Common Name should be assign for each of IBA by eBird / BIRD COUNT OF INDIA with definite identified boundries.When any eBird submit checklist from said IBA a previously decided Name of IBA should be display for eBirder.
—
This was received by us on 2 Nov, but not added to the list of questions as it is a suggestion about an eBird feature rather than a suggestion for how to analyse the data. Please correct me if I’m wrong. Thanks!
OK
OK
How should I get male,female or juvenile population of a particular bird specis ref to area/location/habitat/field.How I locate breeding locations of migrated birds in India for observations?
It is very difficult to identify & update data as male,female,juvenile in birds.more difficult Nonbr/br stages.Checklist should be link with respective male,female species photographs & audio calls.
Could you clarify how to submit?
By email: [email protected]
There is data collection method for each bird species in the tabular format as male/female/juvenile etc with breeding codes.99% checklists without this information.Yes it is very difficult also to submit all such information in field since you have to record bird after fractions of second of presence infront of you.
But if any immediate link provisions or any offline data methods are there next to bird name to access photographs /audio calls/etc to identity male/female/juvenile/br-nonbr plumage…eBirder will take interest to log information as male/female after comparing the immediate data available infront of bird name.
We have photographs & audio calls in media sections & one can access with name of species.Same data can be available with link infront of species name in checklist.Due to ready avability of such information eBirder will take interest to identify /login specific information.
Here is our future need that photographs & audio calls should segregated with male/female marks.Then only it is easy for eBirder to observe/access / record /update information as male/female, from which respective population information is possible.
Same thing can possible with breeding codes,I think so.If Breeding code is updated properly.
Replied what is in my mind.Guide me accordingly.
Any updates as to when the results will be processed? Would be interesting to also see all the wonderful submissions to this challenge made public once this is done!
Thanks for your enquiry. We should have the results out next week; apologies to all for the delay!
Congratulations Aditya Nayak for winning the ebird data challenge.
Thanks Ajay for the wishes and Birdcount India for the data challenge! All the entries look great, would it be possible to link the pdfs/images of all the entries so that it is accessible to us?
The Results page is not working. seem to be broken