The eBird-India Data Challenge is an invitation to anyone interested to download the c. 4.5 million observations from India and make something new and interesting out of the collated information. The last date for submitting entries for the challenge has been extended to 31 December 2016. If data excites you, please consider taking part, and do tell your friends and colleagues too!
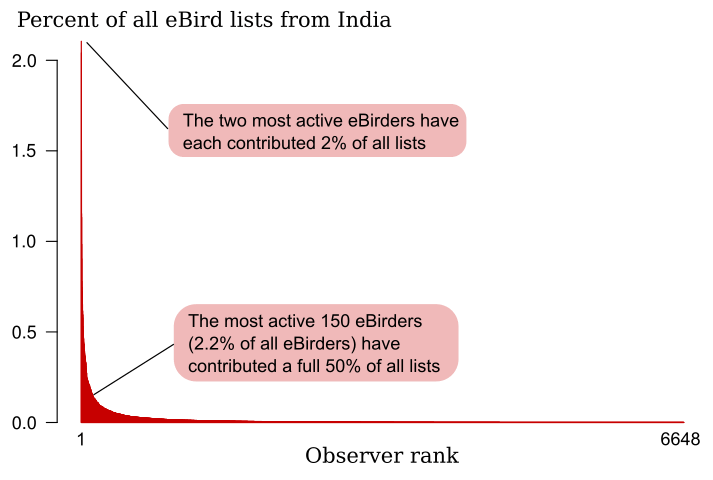
To whet your appetite, here is a graph showing the distribution of effort (measured by number of lists uploaded) across the roughly 6,600 people who have uploaded at least one Indian birdlist to eBird. As is common in projects like this, most activity tends to come from relatively few individuals, and there is a ‘long tail’ of people who, individually, upload rather few lists. As you can see from the graph, the two most active eBird users from India each contributed roughly 2% of all 245,000 lists from India. And taken together, the 150 most active contributors account for a full 50% of all lists! What lessons does this little analysis hold for those of us working to increase participation and data in eBird?


Hi, I’m currently in college and I’ll be learning data analysis over coming couple of months. I’m extremely interested in analysing data of this kind but I don’t have much knowledge right now. I wanted to know if these kind of opportunities will be there in future say after 4 months or so? Maybe not in the form of challenge but for analysis otherwise.
Thanks for the query, Priyal. There are always opportunities to analyse and create new knowledge about the growing eBird dataset in India. Do drop a line to skimmar@birdcount.in when you’re ready and let’s discuss!
Interested
Hi, frankly speaking one must understand how to use the Excel software to go ahead on this challenge. Stuck as to how to analyse the data that i got in excel format.
There is metadata for each column and you can then query each column/attribute and run statistics according to your questions, using any statistical software like R or STATA or even Excel.
Sir,
In Excel, pivot tables can do a lot of this data manipulation and associated visualisation.
http://www.excel-easy.com/data-analysis/pivot-tables.html
Mid-sized eBird datasets can be loaded in excel, butlarge country wide data set may be too huge for excel and may not fit in memory. Then you may need a programming language like R to analyse.
Thanks Praveen. Will try it out.
Ajay
Really challenging challenge.